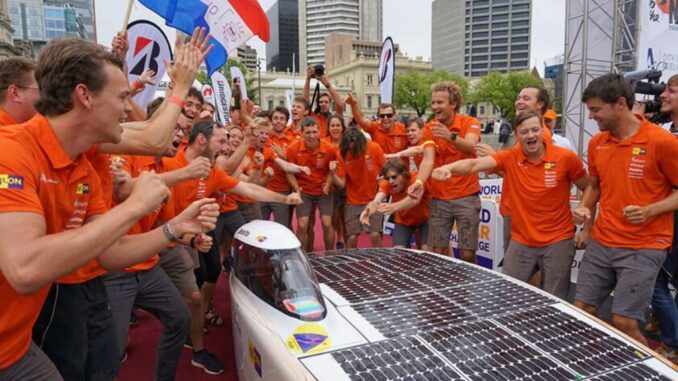
The Bridgestone World Solar Challenge for over 30 years has welcomed the greatest minds from around the world to Australia with their cars powered only by the energy of the sun.
The initiative ams to push the limits of technological innovation and travel the outback in a vehicle powered by solar energy and the teams, usually comprising of tertiary and secondary students, traverse 3,000 kilometres from Darwin to Adelaide in a solar-powered vehicle designed, engineered and built with their own hands.
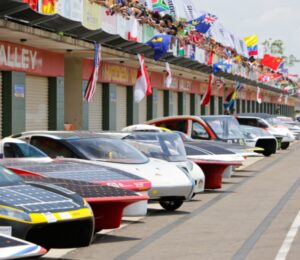 Teams of the Bridgestone World Solar Challenge bring the world’s foremost innovation challenge to list – delivering sustainable personal transport.
The event, the world’s biggest and most prestigious solar challenge, began in 1987 and until 1999 occurs once every three years and than every two years. In 2019, a record 53 entries from 24 countries were received and around 1,500 participants were observed and followed by a global audience of more than 25 million.
The event generates industry partnerships across energy, automotive, engineering, financial, material sciences, and IT sectors. And Bridgestone World Solar Challenge alumni have progressed from participation in the event to employment with some of the world’s leading engineering, automotive, and sustainable transport companies.
The journey
Based on the original notion that a 1000W car would complete the journey in 50 hours, solar cars are allowed a nominal 5kW hours of stored energy, which is 10% of that theoretical figure. All other energy must come from the sun or be recovered from the kinetic energy of the vehicle. These are arguably the most efficient electric vehicles.
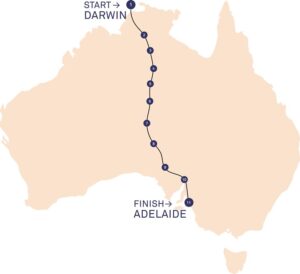 Having made the journey to Darwin by successfully navigating quarantine, customs, scrutineering, safety inspections and undertaken event briefings, participants start their epic road journey.
Once the teams have left Darwin they must travel as far as they can until 5:00pm in the afternoon where they make camp in the desert wherever they happen to be. All teams must be fully self-sufficient and for all concerned it is a great adventure. Many say the adventure of a lifetime.
During the journey there are 9 mandatory check points where Observers are changed and Team Managers may update themselves with the latest information on the weather and their position in the field. At check points, teams can perform the most basic of maintenance only: checking and maintenance of tyre pressure and cleaning of debris from the vehicle.
The classes
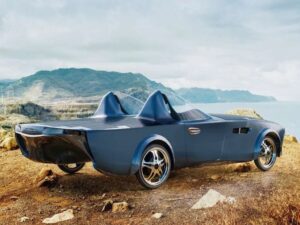 Participating teams enter their vehicle into one of the following three classes:
- The Challenger Class is conducted in a single stage from Darwin to Adelaide.
- The Cruiser Class is conducted as 3 x 1,200km stages without recharging.
- The Adventure Class is a non-competitive class which provides opportunity for cars built for previous events.
The history
1987
- 1st Place General Motors “Sunraycer” (USA) average speed 66.9 km/h
- 2nd Place Ford Australia “Sunchaser” (AUS) average speed 44.48 km/h
- 3rd Place Biel College of Engineering (CH) average speed 42.93 km/h
1990
- 1st Place Biel College of Engineering (CH) average speed 65.18 km/h
- 2nd Place Honda “Dream” (Japan) average speed 54.67 km/h
- 3rd Place University of Michigan (USA) average Speed 52.53 km/h
1993
- 1st Place Honda “Dream” (Japan) average Speed 84.96 km/h
- 2nd Place Biel College of Engineering (CH) average speed 78.27 km/h
1996
- 1st Place Honda “Dream II” (Japan) average speed 89.76 km/h
- 2nd Place United High Schools of Biel (CH) average speed 86 km/h
- 3rd Place Aisin Seiki “Aisol III” average speed 80.7 km/h
1999
- 1st Place Aurora “Aurora 101” (AUS) average speed 72.96 km/h
- 2nd Place Queens university “Radiance” (CAN) average speed 72.17 km/h
- 3rd Place University of Queensland “Sunshark” (AUS) average speed 71.68 km/h
2001
- 1st Place Nuna “Alpha Centauri” (NL) average speed 91.81 km/h
- 2nd Place Aurora “Aurora 101” (AUS) average speed 90.26 km/h
- 3rd Place University of Michigan “M-Pulse” (USA) average speed average speed 87.37 km/h
2003
- 1st Place Nuon “Nuna II” (NL) average speed 97.02 km/h
- 2nd Place Aurora “Aurora 101” (AUS) average speed 91.90 km/h
- 3rd Place MIT “Tesseract” (USA) average speed 90.20 km/h
2005
- 1st Place Nuon “Nuna III” (NL) average speed 102.75 km/h
- 2nd Place Aurora “Aurora 101” (AUS) average speed 92.03 km/h
- 3rd Place University of Michigan “Momentum” (USA) average speed 90.03 km/h
2007 (NB lower average speed due to 25% smaller solar panels)
- 1st Place Nuon “Nuna 4” (NL) average speed 90.87 km/h
- 2nd Place Umicore “Umicar Infinity” (Belgium) average speed 88.05 km/h
- 3rd Place Aurora “Aurora 101” (Australia) average speed 85 km/h
 2009
2009
- 1st Place Tokai University “Tokai Challenger” (Japan) average speed 100.54 km/h
- 2nd Place Nuon “Nuna V” (NL) average speed 91.88 km/h
- 3rd Place University of Michigan “Infinium” (USA) average speed 90.49 km/h
2011
- 1st Place Tokai University “Tokai Challenger” (Japan) average speed 91.54km/h
- 2nd Place Nuon “Nuna 6” (NL) average speed 88.6 km/h
- 3rd Place University of Michigan “Qantum” (USA) average speed 84.33km/h
2013
- 1st Nuon Solar Car Team “Nuna 7” (The Netherlands) average speed 90.71
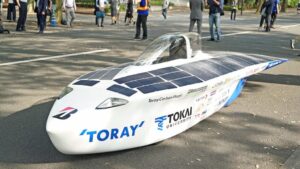
- 2nd Tokai University “Toray” (Japan) average speed 82.43
- 3rd Solar Team Twente “The Red Engine” (The Netherlands) average speed 79.67
2015
Challenger Class
- 1st Nuon Solar Car Team “Nuna 8” (The Netherlands) average speed 91.75
- 2nd Solar Team Twente “Red One” (The Netherlands) average speed 91.63
- 3rd Tokai University “Tokai Challenger” (Japan) average speed 89.41
Cruiser Class
- 1st Eindhoven “STE2” (The Netherlands). Total Score: 97.27 points
- 2nd Kogakuin “Owl” (Japan). Total Score: 93.61 points
- 3rd HS Bochum “Sunriser” (Germany) Total Score: 82.91 points
2017
Challenger Class
- 1st Nuon Solar Car Team “Nuna 9” (The Netherlands) average speed 81.2km/h
- 2nd University of Michigan Solar Car Team, “Novum” (USA) average speed 77.1km/h
- 3rd Punch Powetrain Solar Team “Punch Two” (Belgium) average speed 76.2km/h
Cruiser Class
- 1st Solar Team Eindhoven “Stella Vie” (The Netherlands). Total Score: 100 points
- 2nd HS Bochum “Thyssenkrupp Blue Cruiser” (Germany) Total Score: 51.9 points
- 3rd Clenergy Team Arrow “Arrow STF” (Australia). Total Score: 32.5 points
2019
Challenger Class
- 1st Agoria Solar Team, “Bluepoint” (Belgium) average speed 86.6 km/h
- 2nd Tokai University Solar Car Team, “Tokai Challenger” (Japan) average speed 86.1 km/h
- 3rd University of Michigan Solar Car Team, “Electrum” (USA) average speed 79.6km/h
Cruiser Class
- 1st Solar Team Eindhoven “Stella Era” (The Netherlands). Total Score: 104 points
- 2nd SUNSWIFT, “Violet” (Australia). Total Score: 39 points
- 3rd IVE Engineering Solar Car Team, “Sophie 6s” (Hong Kong) Total Score: 28 points
Source: Bridgestone World Solar Challenge


Be the first to comment